

Report cards came out two weeks ago, and Westerville City Schools received both high and low marks. Some areas improved, while others still need work.
Like the report cards students receive, Ohio’s annual school report card doesn't provide a simple pass-or-fail judgment. Instead, it measures performance in different areas, showing where a district meets or exceeds state expectations and where it may need greater attention.
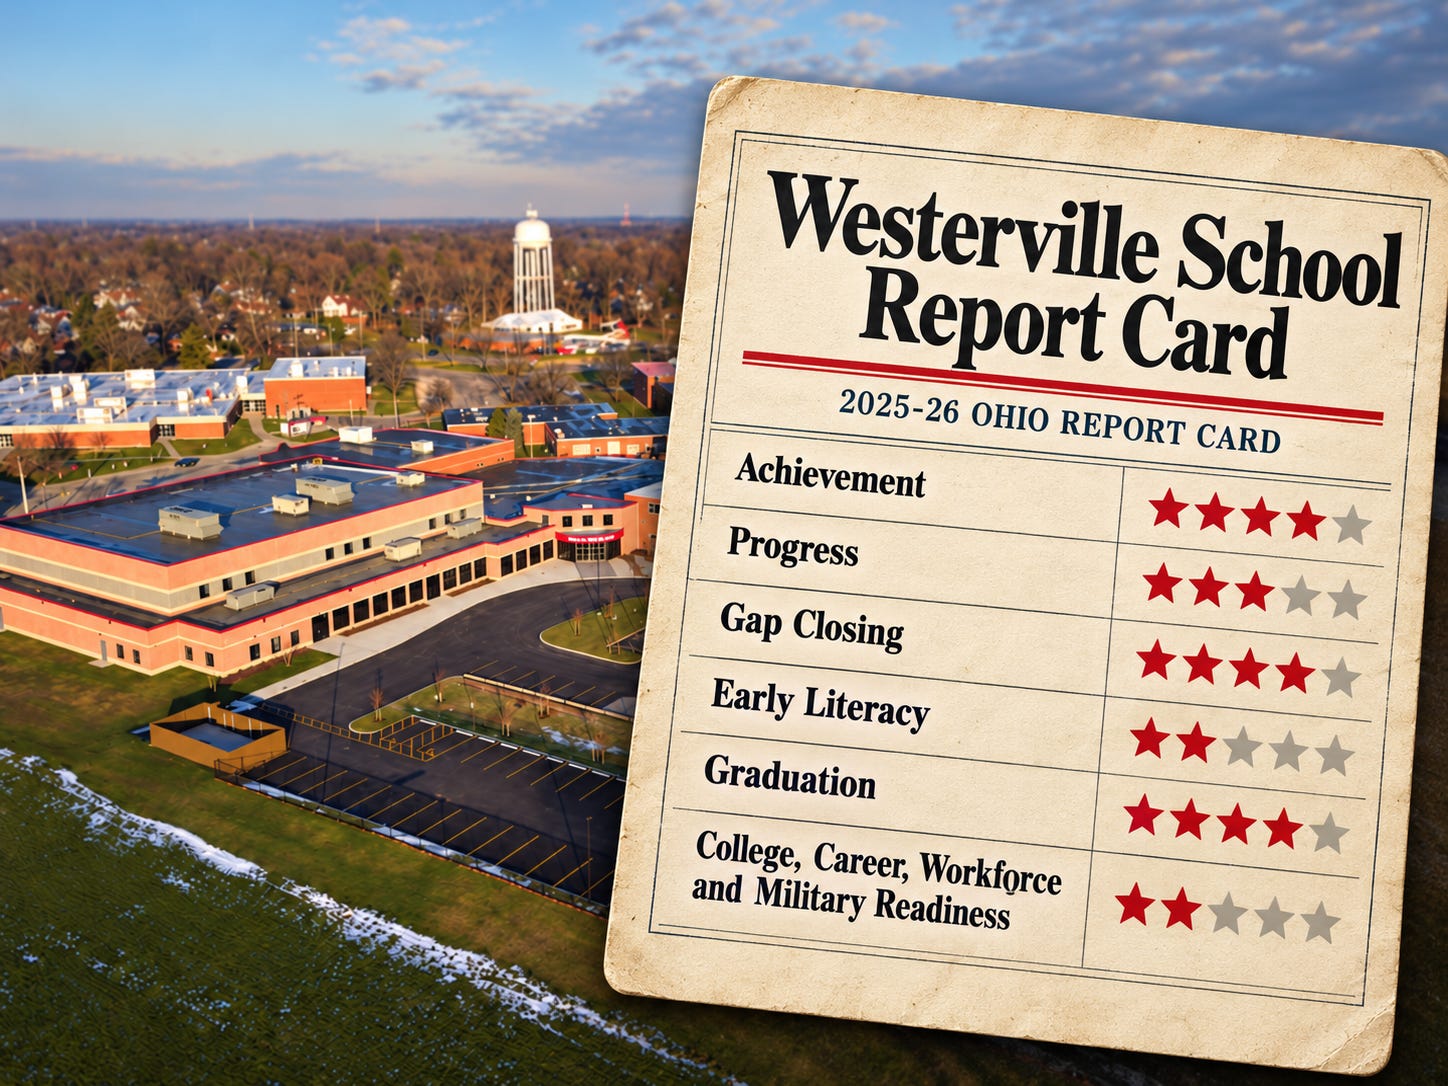
For Westerville, that produced a mixed report card. The district earned four stars in Achievement, Gap Closing, and Graduation. It received three stars for Progress and two stars for Early Literacy and College, Career, Workforce and Military Readiness.
The results will be part of a school board work session Tuesday focused on academic data and the district’s Multi-Tiered System of Supports, or MTSS, which uses student data to identify students who need additional support or enrichment.
The timing puts the report card alongside the district’s efforts to determine where students are succeeding and where additional work is needed. Early literacy, mathematics growth, and chronic absenteeism are among the areas district officials say require attention.
Reading the ratings is not as simple as counting stars on a chart. Instead, the categories measure different things, and sometimes seemingly conflicting results reflect different aspects of student performance.
Achievement and Progress provide one example. Achievement reflects student performance on state assessments, while Progress measures how much academic growth students make compared with their previous performance, district spokeswoman Melanie Amato said.
Westerville earned four stars in Achievement for the second consecutive year. Its Progress rating, however, slipped from four stars last year to three stars this year. Three stars means the district met the state’s expectations for student growth, while four stars indicated growth exceeded expectations.
District academic and assessment teams are reviewing the data by grade, subject, school, and student group to determine where growth was strongest and where changes may be needed.
Westerville’s Performance Index percentage declined from 81.7% last year to 81.1% this year, although the district’s raw score declined by only 0.3 points. That percentage also reflects changes in the state benchmark against which districts are measured, meaning the change does not represent an equivalent drop in Westerville’s raw performance.
Amato said maintaining four stars in Achievement was encouraging, although district officials are not satisfied with simply maintaining current performance.
The Westerville Education Association, which represents district teachers, was also asked to respond to questions about the report card. The questions were sent three days after the report card was released, but the union did not respond before publication.
Early Literacy remained at two stars, although results within the category moved in different directions. Westerville’s Improving K-3 Literacy measure increased, while third-grade reading proficiency declined.
District officials continue to identify early literacy as an area needing improvement. Westerville is working to strengthen literacy instruction, identify reading needs earlier, and provide intervention for students who need additional support. Those efforts are tied to MTSS and the increased emphasis on Tier 1 instruction.
Another Early Literacy number shows why comparisons between report cards can be misleading. For example, last year, Westerville’s report listed 99.9% for Promotion to Fourth Grade. This year’s report lists 70.6% for “Promotion to Fourth Grade by Meeting Test Score Requirements.”
The difference does not mean nearly three in 10 Westerville third-graders were prevented from advancing to fourth grade. Amato said House Bill 96 changed which students are counted in the state calculation.
“HB 96 solely impacted how the measure on the report card is calculated, not whether a student can be promoted,” she said.
Westerville would have recorded another 99.9% had the previous calculation remained in place, according to the district.
Westerville also maintained four stars in Gap Closing, a category that examines how different groups of students are performing. English learners were among the district’s stronger areas, receiving full credit within the component.
But four stars did not mean Westerville met every goal. The district received no points for math growth and chronic absenteeism.
Westerville’s chronic absenteeism rate increased from 17.8% to 18.2%, above the state goal of 14.5%. It was the second consecutive year the district failed to meet the state benchmark for reducing chronic absenteeism. The measure counts students absent for at least 10% of the school year.
District administrators monitor student attendance, communicate with families, and develop plans for students with attendance problems. Amato said students need to be in school whenever they are healthy and able to attend.
The combination of four stars in Gap Closing and no points in some underlying measures shows why a single star rating does not describe everything happening within a school system.
A similar contrast appears near the end of a student’s school career. Westerville earned four stars for Graduation. Its four-year graduation rate was 93.1%, compared with 93.6% last year, while the five-year rate increased from 94.4% to 96.3%.
District officials see the five-year increase as evidence that students who do not finish within the traditional four years continue to receive support. “The five-year rate tells us that students who need additional time are continuing to receive support and remain connected to a pathway toward graduation,” Amato said.
But graduating and meeting Ohio’s definition of readiness after high school are not the same thing.
Westerville received two stars in College, Career, Workforce and Military Readiness. The state measure includes indicators such as college credit, qualifying Advanced Placement or International Baccalaureate scores, industry credentials, and other approved pathways.
Westerville’s readiness percentage was 59.3%, up slightly from 59.1% last year. District officials question whether the measure captures all the ways students prepare for life after high school.
“We do not believe this component accurately reflects our students’ post-graduation readiness,” Amato said.
Taken as a whole, the report card shows a district with strengths in Achievement, Gap Closing and Graduation, but continuing concerns in early literacy, mathematics growth, chronic absenteeism and preparation for what comes after high school.
Tuesday’s school board work session turns the discussion toward what comes next, with academic data and MTSS at the center of the district’s review.

Because this post is public, you’re encouraged to share it on social media.
The Westerville News is a reader-supported publication by Gary Gardiner, a lifelong journalist who believes hyper-local reporting is the future of news. This publication focuses exclusively on Westerville—its local news, its influence on Central Ohio, and how surrounding areas shape the community.
Reader funding, including subscribers, protects editorial independence, so coverage is guided by journalists rather than owners or corporate profit goals. It also reduces pressure to chase clicks, letting the newsroom focus on stories worth readers’ time. And it helps keep the site accessible to everyone, including people who can’t pay or live in places where a free press is under threat.
Explore more hyper-local reporting by subscribing to The Hilliard Beacon, Civic Capacity, Marysville Matters, The Ohio Roundtable, Shelby News Reporter, This Week in Toledo, and Into the Morning by Krista Steele.
